Platform Features Release: New Zoom Functionality, Chart Panning
Announcing the latest Release of feature and functionality additions and enhancements to the trading platform to assist the investment/trading decision process.
New Zoom Functionality
To activate Zoom, click on the Zoom button has been added to the icon toolbar:
![]()
- Once activated, the button changes color.
- Click/drag the mouse/cursor over the area of study.
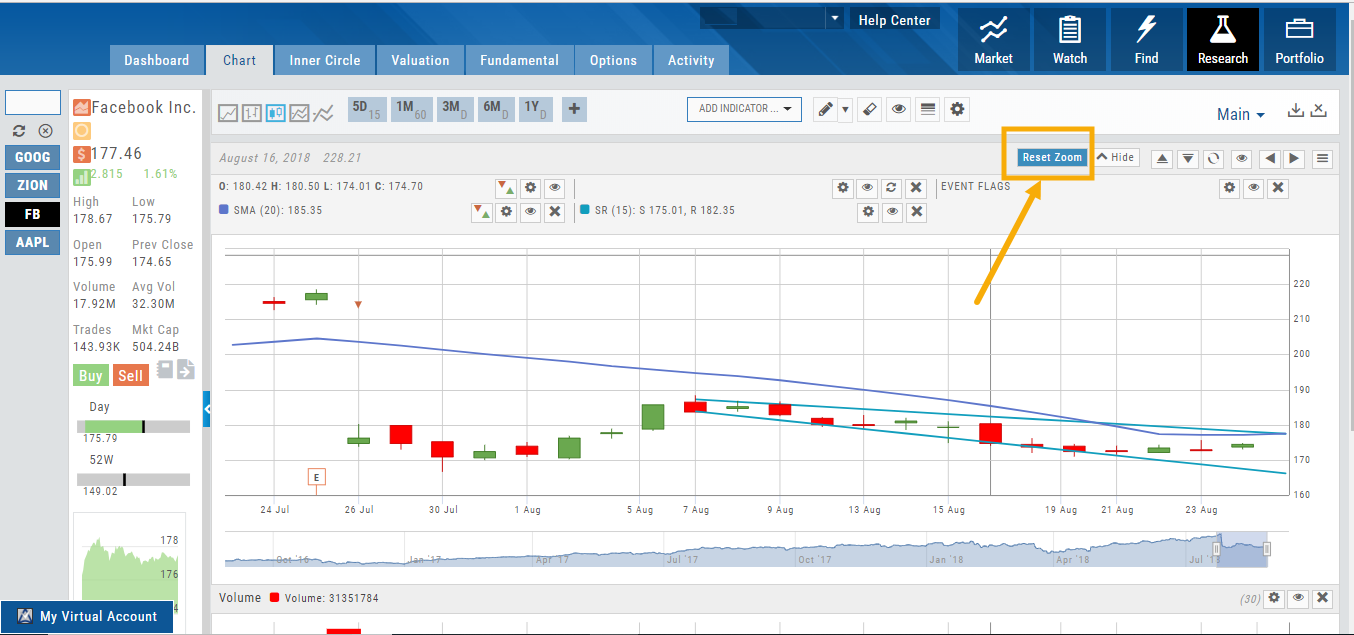
- A “Reset Zoom” button will display when you want to restore the view.

Chart Panning Functionality
Click/drag now pans the time period/price range on the chart – when dragging your mouse/cursor either right/left or up/down.
Other Additions
- “Choppiness Index” Chart Lower Indictor added
- “Are You Sure You Want To Cancel This Order?” added on Order Status tab
- Clicking on “Quotes By” box (lower right corner) will display source of quotes
Change Log
- Reuse .XSP and .SPX order functionality restored
- Trading Block OTM trade error fixed
- Schwab recognizes BRK.B now
- Resolved Liquidity Range in Screener
Platform Features Release: August 2022
Announcing the latest Release of feature and functionality enhancements to the trading platform. These allow for more customizing ability and streamlines functions on accessing or displaying information. Highlights include:
Screen for Weekly Options – The ability to screen for weekly options has been added to the Screen Function under Find.
Rearrange Screener Data Points – Change selection order directly on the Results page, by drag/drop action.
Large Chart Widget on Custom Page –The new widget fits an entire row on the custom page.
Customize Moving Averages – The Moving Average thickness can now be customized.
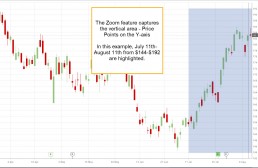
Vertical Zoom on Chart – Function expanding to allow for Horizontal and Vertical Zoom.
Double-click function on Expiration Cycle Page –Eliminates need to click “Okay” button
Screen for Weekly Options
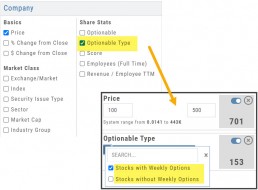
The Screener – located under the Find Tab – now provides the ability to screen for Weekly Options.
Now customizing your own searches is even better!
Remember, you can save Screens for future use – and even edit/update them as needed.
Rearrange Screener Criteria
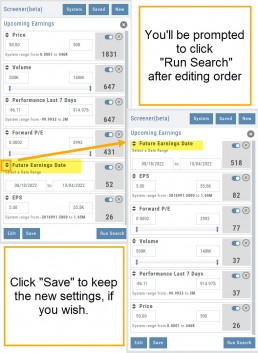
Rearrange Screener data points on the Results page by clicking ![]() located on the upper left corner of each data point, then drag up/down.
located on the upper left corner of each data point, then drag up/down.
The data points are filtered with each entry in the order they are listed.
Additional edits can be made with the existing Screener data points:
Click ![]() to keep the data point but disregard in an updated “Run Search”.
to keep the data point but disregard in an updated “Run Search”.
Click ![]() to remove the data point from an updated “Run Search”.
to remove the data point from an updated “Run Search”.
Save to keep the edited Screener for future use.
Large Chart Widget on My Custom Page
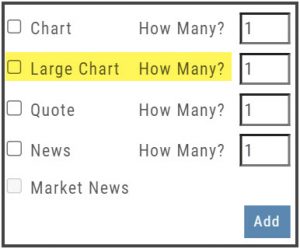
An individual chart can be set on an entire row on the Custom Page by selecting the Large Chart widget.
The Custom Page set-up and arrangement remain the same.
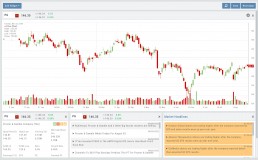
Customize Moving Average Lines
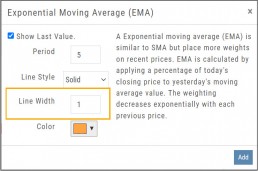
All Moving Average Indicators, Exponential, Simple, Triangular and Weighted can be customized to set Line Width. The default setting is ‘1’.
This update, along with previously added, user-defined “Line Type” allows for even more identification in charting analysis.
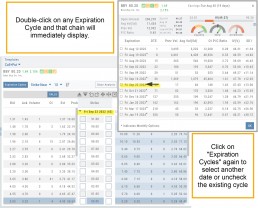
Expiration Cycle Double-click Functionality
Quickly access one or more Expiration Cycles by double-clicking on each row you wish to evaluate.
The selected dates will automatically display on the Chain.
Click “Expiration Cycles” button again to revise/add to existing cycles.
Vertical & Horizontal Zoom Functionality
Change Log
- Corrected “Extend By” behavior on Chart with Streaming
- Created ability to reconcile partial trades
- Updated Annotation editing capability when adding text
- Resolved Edge browser/Annotations conflict
- Volatility Stop Indicator – expanded
- Fixed navigation break: Chain>Chart>Chain
- Analyze function restored on certain strategies
- Alert tool-tip correction
- Adjusting Parallel lines now saving
- Corrected Pending/Executed Order on Chart display
Zoom Feature
Activate the Zoom Feature on the Chart by clicking on the Icon as shown:
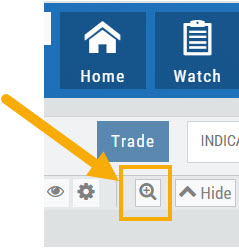
The icon will darken when activated – or, depending on your theme, may show up brighter: ![]()
You can then “Click/Drag” your cursor.
A “Reset Zoom” button will automatically appear on the new display. When you are finished with your studies, simply click to restore the original time-period setting.
