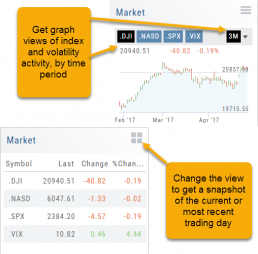
In the default Graph View, get an visual view of Market or Volatility Index activity by a 1-day or 1, 3 or 6 month time frame. By sliding your cursor along the graph, an activity box will display more in-depth activity: Every two minutes for the 1-Day Graph, or Daily for the 1, 3 or 6 month graph.
The current market activity/most recent trading day, regardless of time-frame, is present on the default view under the Index box selections – or by selecting the List View to get: Current, point change and percentage change (green = positive, red= negative).