Journal Tag Analytics
Want to know how effective your trading strategies and practices are? This is where you’ll get your answers
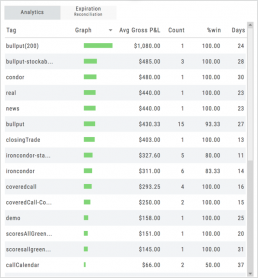
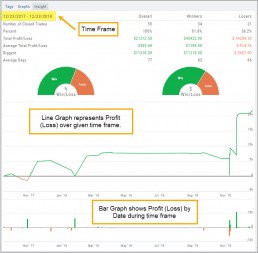
Get visual feedback broken down by strategies and analytical data including a Profit Graph, Average Gross P&L, the frequency of each strategy executed, % Win Ratio, Number of Days in a Trade.
Journal Analytics is a powerful tool to reinforce consistency in the practice of the trading process- from the overview, evaluation, research, execution and exiting. Journaling identifies what works, what needs more discipline, etc. Analytics provide this information in easy-to-read data.
Updating Journal Entries
Updating closed or adjusted trades in the Journal Tab is easy by the following steps:
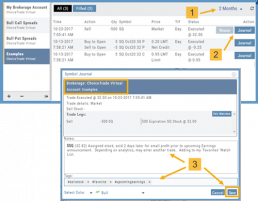
1. Go to the Order Status Tab, change the default “Today” in the upper-right area of the tab for previously executed trades.
2. Click “Journal” for the trade you want to update.
3. You can add Notes, #tags, outlook to be included in the Journal. Click “Save”. (Note the Account Name where this trade will appear)
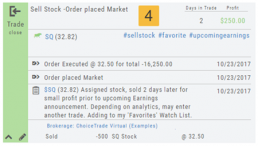
4. The trade is now updated in the Journal Tab. Expand the tab to see trade detail: Number of days in the trade, the profit (loss), order execution details, notes, tags, the Account Name containing the trade, etc.
The Analytics section will update using tags from these trades, further assisting in tracking progress in your trading.
Create Notes to Keep Organized
Notes are easily created throughout the Platform.
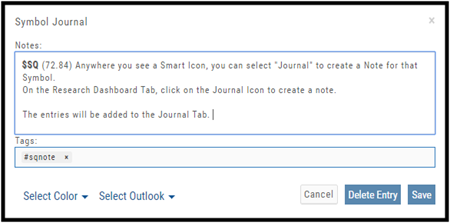
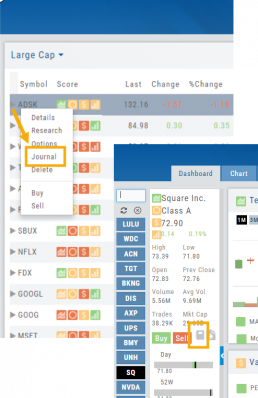
Anywhere you see a Smart (Action) Icon ![]() , you can create a Note to be added to the Journal Tab.
, you can create a Note to be added to the Journal Tab.
Simply click on the icon and select “Journal” for the Symbol and current price to be captured.
The Research Tab also has a Journal Icon located on the Symbol Summary Box on the left side of the screen.
Use as a Clipboard
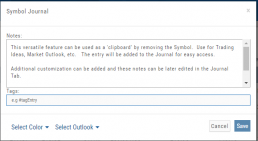
Notes can be used as a Clipboard to help you with your Trading system. Use it for Ideas, Market Conditions, even for Trading Education Classes.
Simply create a Note as previously indicated, then remove the $stock symbol and pricing information.
Now you have a Clipboard to keep customized notes.
You can further customize your Notes with your own tags. Read more about creating your own #tags
Notes can be Edited at any time in the Journal Tab
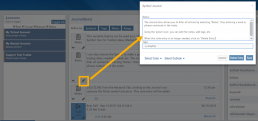
Click on the ‘pencil icon’ to add or edit your notes, add#tags, outlook etc. For more info on adding tags: Click HERE
Then click “Save“.
If you no longer need this note, simply click on the pencil icon, then “Delete Entry“
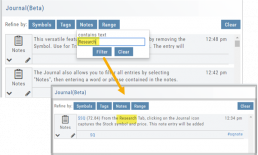
The Journal give you the ability to view only Notes. On the left panel of the Journal Tab, select “Notes” from the Account Selector.
You are further able to refine your search by specifying text contained in the Notes. Select “Notes” in the middle panel of the Journal, then type in text that would appear in the Note entry. Click on “Filter”.
When finished, click “Clear“.
Tag Results-Table Summary Totals
Located below the Analytics Tab in the Journal, the Tag Result Table Summary displays trade performance by Date Range, Total P/L, Average P/L, Number of Trades (Count), % Profitable and Average Number of Days in Trades.

This data is dynamically updated by available filters including:
Type of account(s) (Manual, Virtual &/or Live)
Specific trading account(s)
Date Range
Stock symbol
Tags

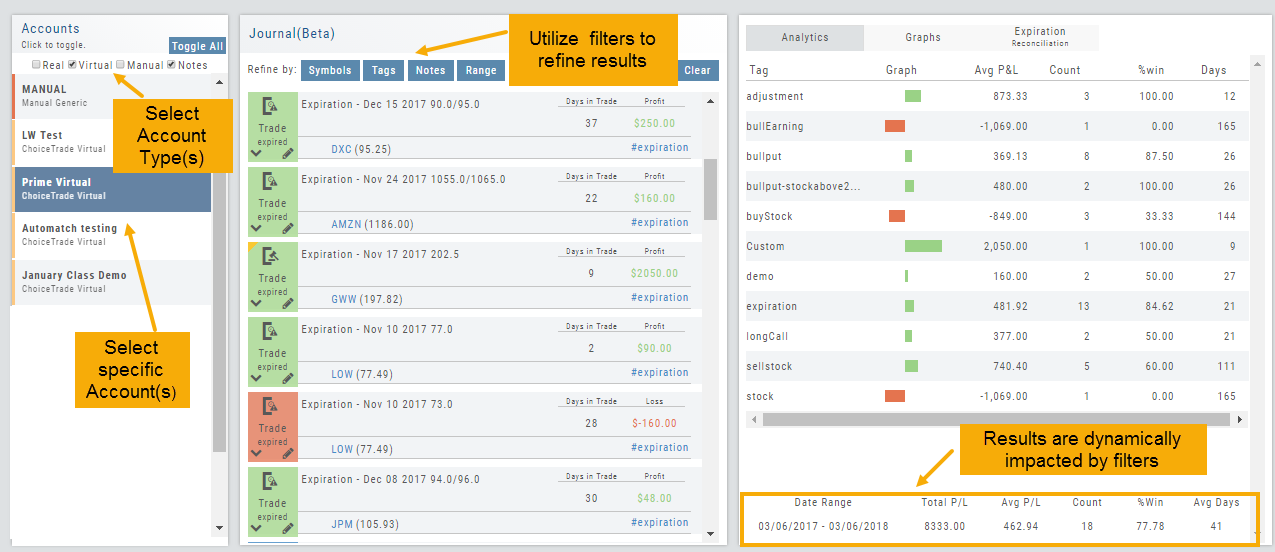
Not only does this table provide valuable information, you can use it to compare strategies, track improvement in your overall trading, etc.
Insight Tab in Journal
The Insight Tab, along with Tags and Graphs update dynamically with the account(s), symbol(s), tag(s) and/or date range selected.
Insight breaks down Overall Performance by Winning and Losing trades in addition to:
- Number of closed trades
- Percent (Winning/Losing Trades)
- Total $ Profit/Loss
- Average Total Profit/Loss
- Biggest (Winning/Losing Trade)
- Average Days in Trade
P/L & Duration/Timeline Graphs
Journal Trade Graphs
This tab offers two views of your Closed, Matched or Reconciled trades: P/L by Trade Duration and P/L by Timeline. The views update dynamically by Account, Symbols, Date Range and #tags.
The Timeline Graph.
Click/Drag your cursor to adjust/enlarge the orientation view.
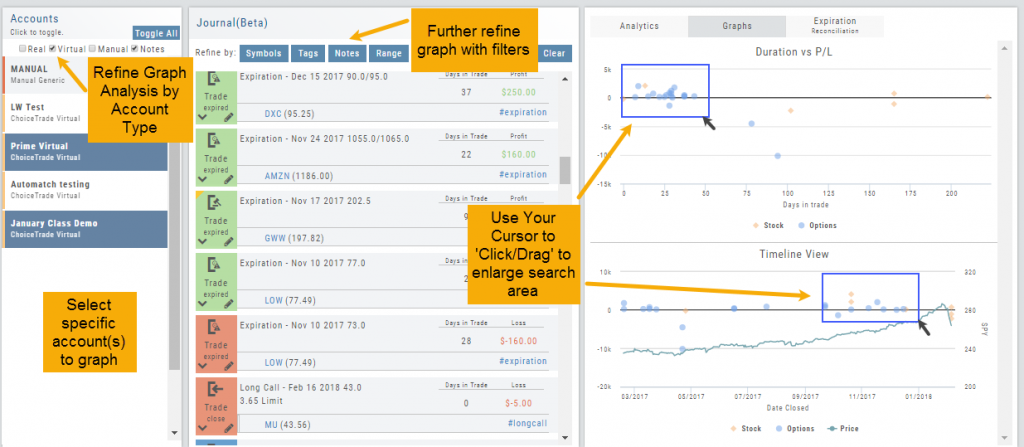
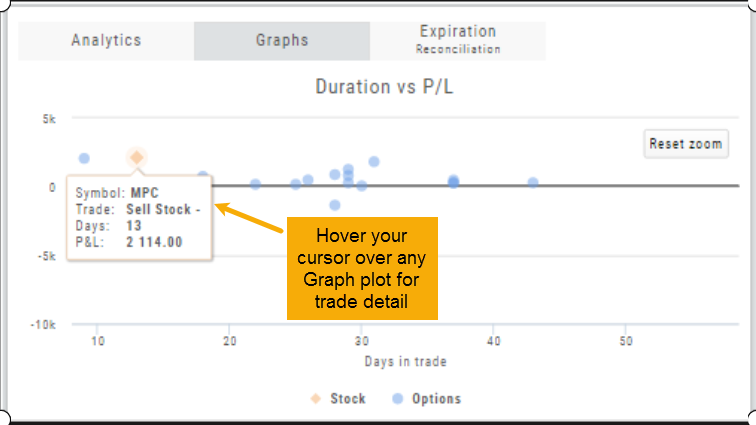
Hover your cursor over each graph plot for trade detail. Circles = Option Trades, Diamonds = Stock Trades. The Duration View shows P/L and # of Days in the Trade
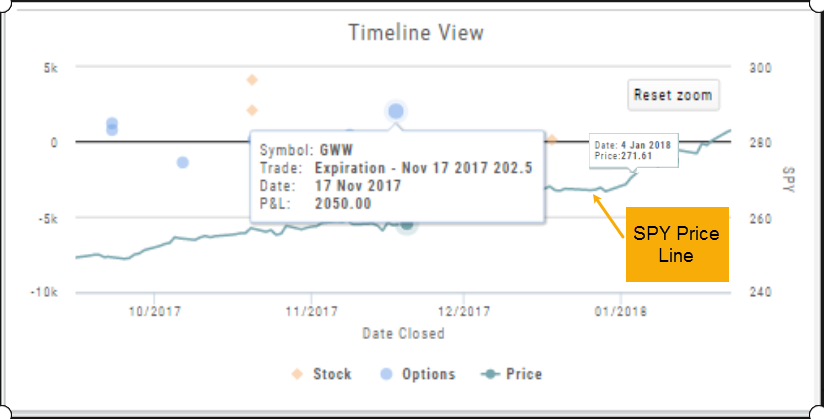
Timeline View displays P/L on Date Closed or Expiration
SPY Price is displayed on the Timeline View. Slide your cursor along this graph line to show end-of-day price for that date.
Add New #tags and Auto-Tagging
Trade Finder Scans have #tags that will automatically appear on the corresponding trade tabs in the Journal, such as #BullCall, #BullPut or #CoveredCall, for example. Trades built manually will default to #custom. In addition, trades that have expired will be auto-tagged: #expiration.
You can revise these tags and/or add your own, by the following steps: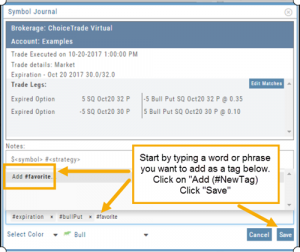
1. On the Journal Tab, select the Trade entry you wish to edit by clicking on the Pencil Icon.
2. In the Tags section (lower part of box), start typing the word/phrase you wish to use. Example: favorite
(It is not necessary to enter the ‘#’ symbol first).
3. Click on “Add (#NewTag)“, then Save.
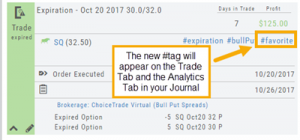
4. The new Tag will be on the individual Trade tab and the Analytics section of the Journal.
Backtest from the Journal
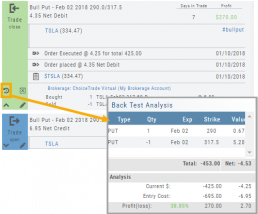
You can “Replay” a trade from your Journal by sending it to Backtest Analysis.
Click on the ![]() icon on the Journal trade tab.
icon on the Journal trade tab.
Trades are sent to the specific strategy template of the trade.
If you click on the “Trade Open” tab, you will only get that view of the trade.
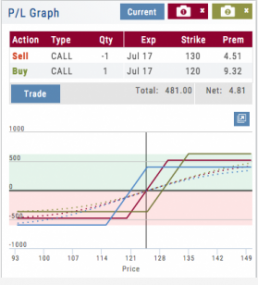
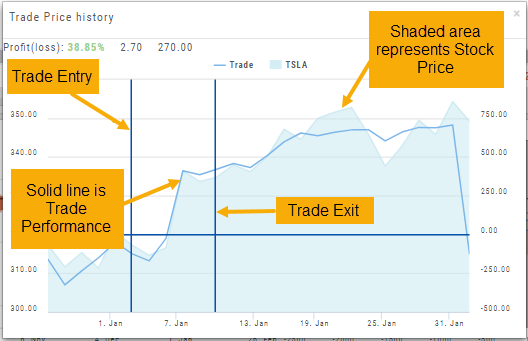
View the P/L, Price History, Stock Volatility Chart – be sure to utilize the “Go Big” function to see more detail of the trade.
Click Here for more on Backtesting
I own the stock, how to I enter a Covered Call trade?
When you already own the stock, but want to enter a Covered Call position, follow the following steps:
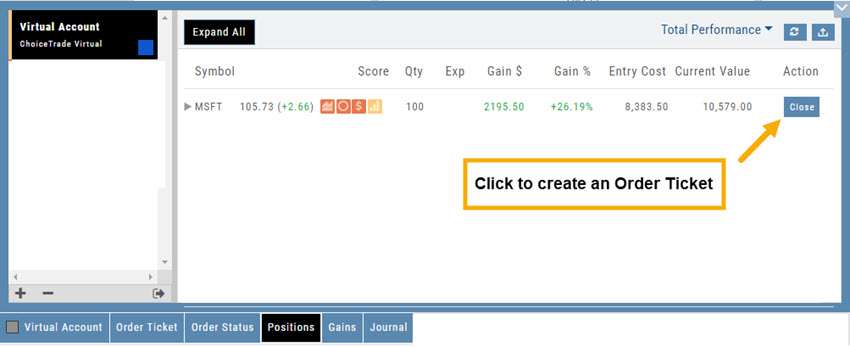
1. From the Positions Tab, click “Close”
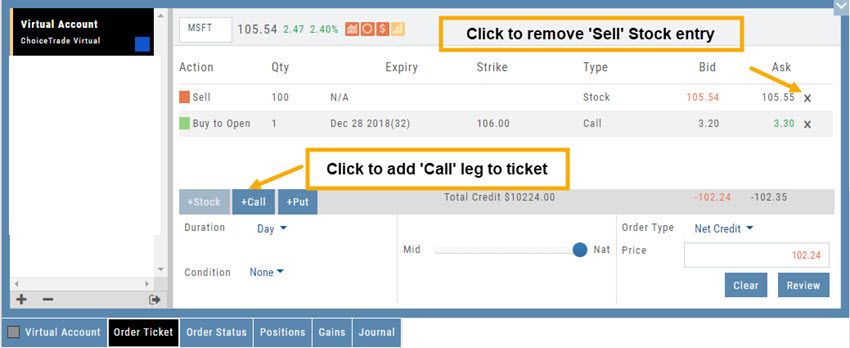
2. Add Call Leg (you’ll adjust this later) & Delete Sell Stock entry line:
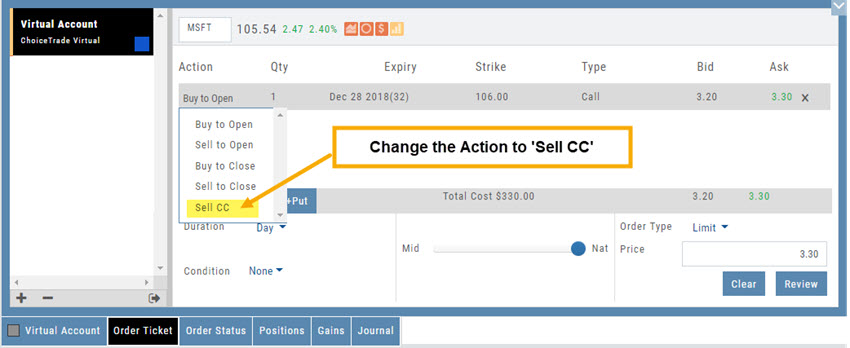
3. Change Action to Sell CC. Make any other adjustments to this Order Ticket, click “Review” to check for accuracy, then “Submit“.
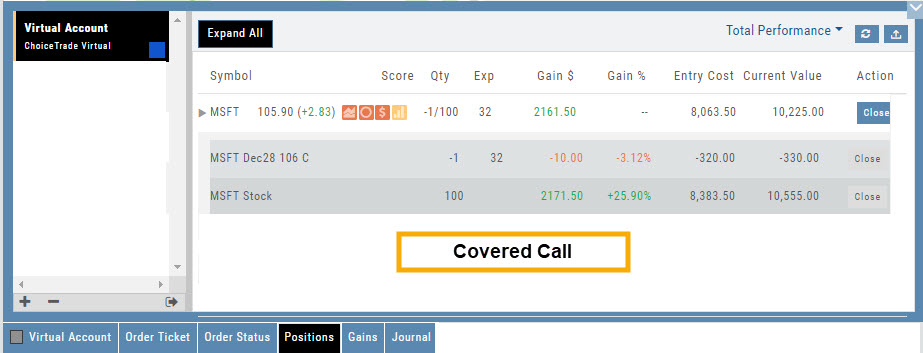
4. After the Order executes, it will show up in the Positions Tab as follows:
